Conditional Lenses
With the launch of Enterprise Lens 3.3, illustrators can now craft lenses tailored to specific criteria.
| TABLE OF CONTENTS | |
|---|---|
| 1. Getting started | 2. Import the Lenses |
| 3. Create the Lens Menu | 4. Turn on the Lenses |
1. Getting started
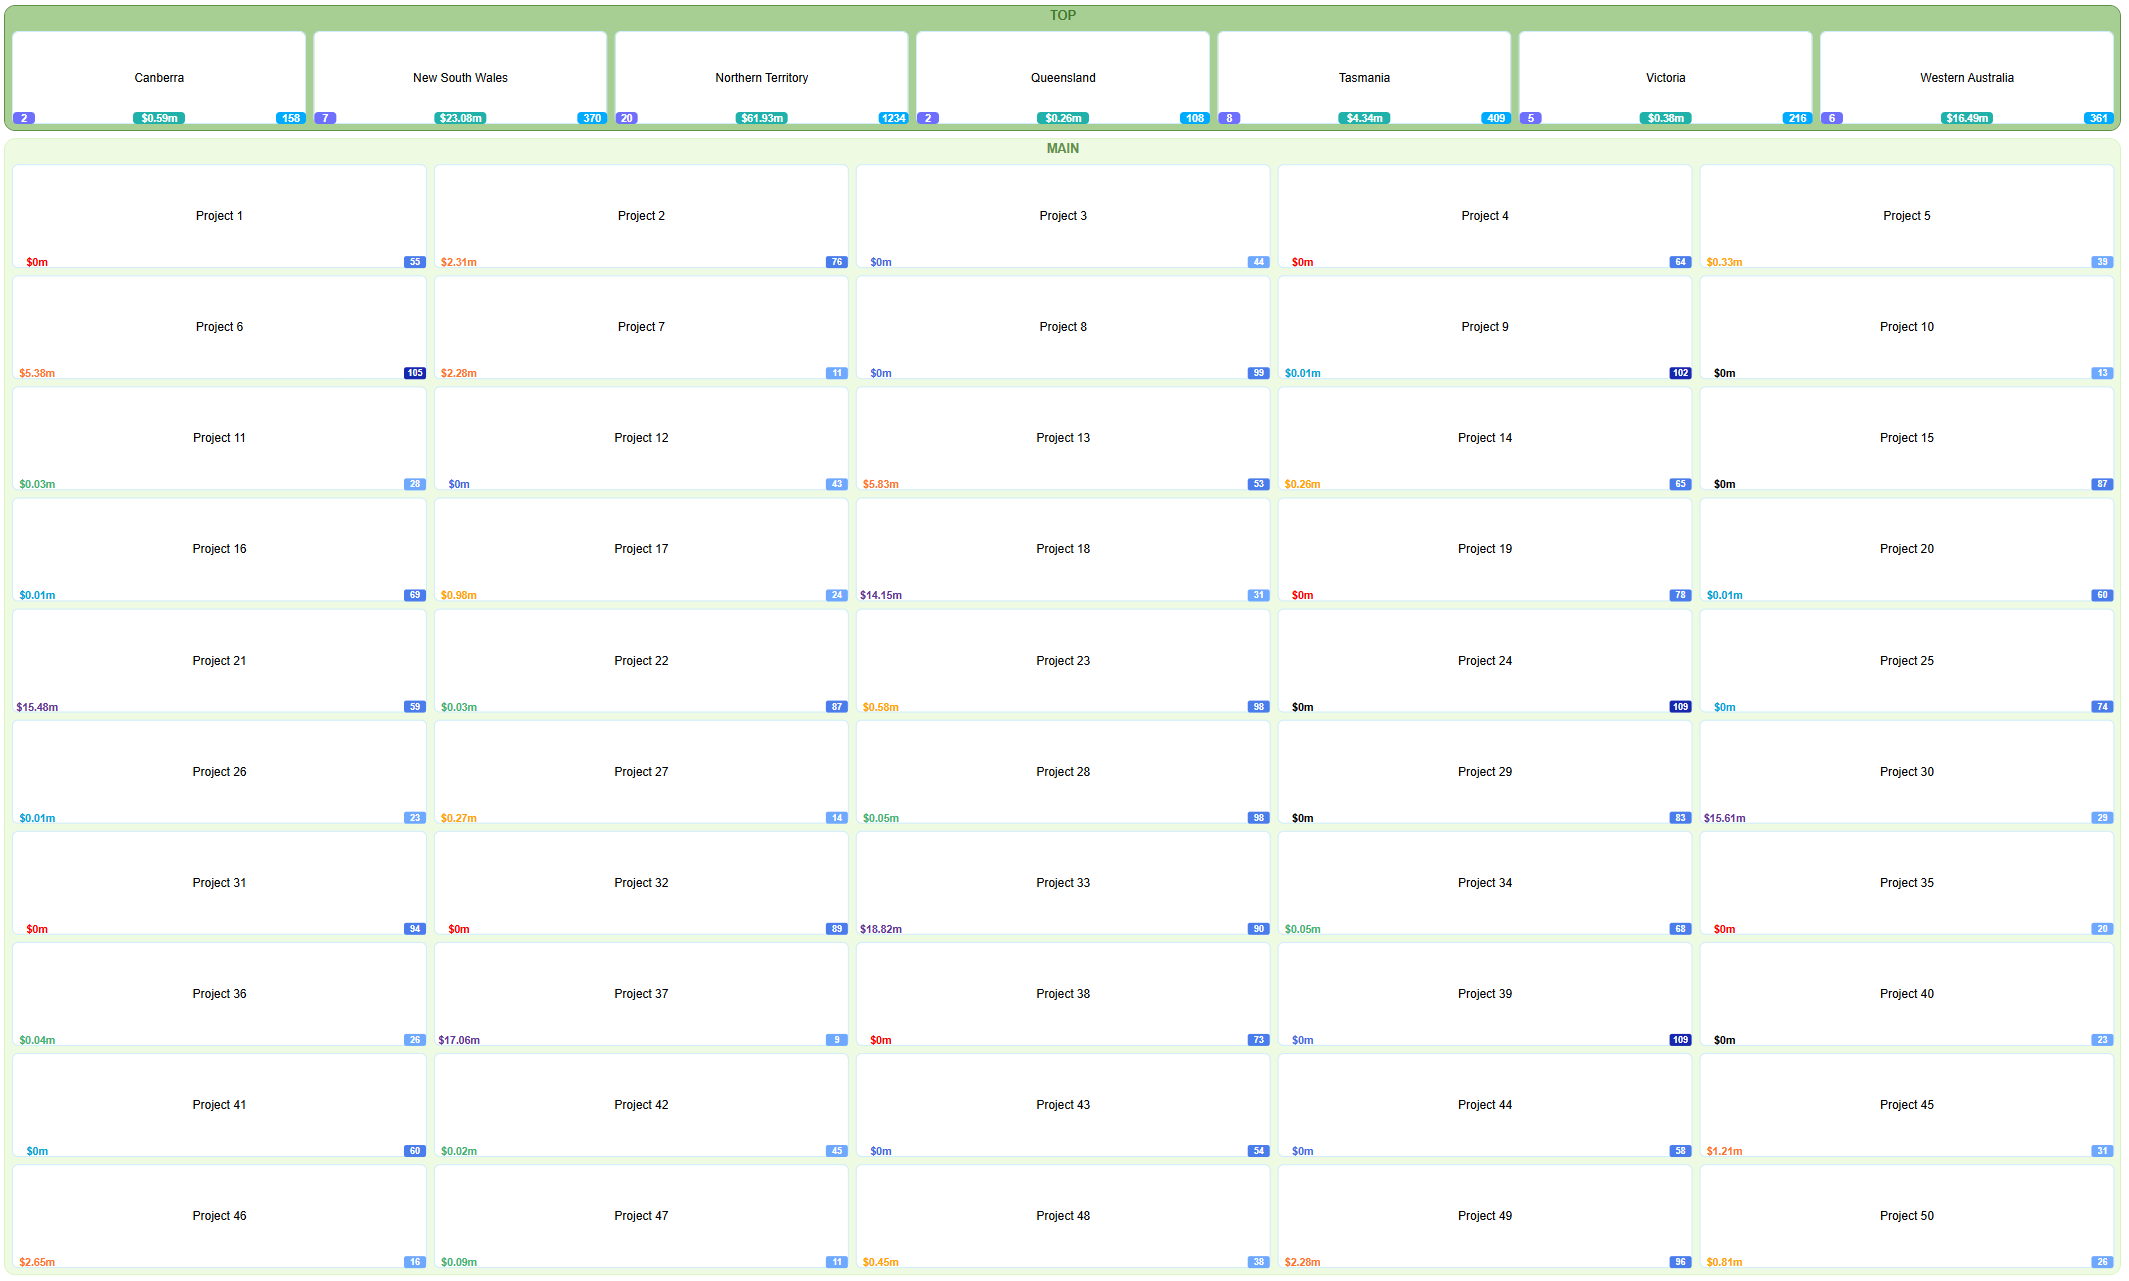
Below is an example illustration of lenses being conditionally formatted.

Each project has two lenses to look at:
- Cost (on the left)
- If the cost is less than 0, it's shown in red.
- If the cost is exactly 0, it's shown in yellow.
- If the cost is greater than 0, it's shown in green.
- People (on the right)
- If there are no people, it's grey.
- If there are fewer than 50 people, it's light blue.
- If there are 50 to 99 people, it's blue.
- If there are 100 or more people, it's dark blue.
This guide will teach you how to quickly recreate the above conditionally formatted illustration.
1.1. Select the Sample Illustration
To start, let's navigate to the Training illustration we will use for this guide.
- Log onto Enterprise Lens.
- Click on the Enterprise Lens folder.
- Click on Training folder.
- Finally, click on the Conditional Formatting Illustration.
Included below is an interactive image to guide you step by step.
2. Import the Lenses
This illustration already has Cost and People values for each project, which you can view by clicking any Project box. As such, we are ready to import our lenses.
- Find Import in the menu on the right-hand side, under Box Types, and click it.
- In the new menu, click Select Illustration.
- Click Select next to Enterprise Lens.
- Next, click Select next to Lens Library.
- Look for Lens Library 3.4, click Select, and then click OK at the bottom.
- On the left, click the small triangle next to Conditional Formatting to open it.
- Tick the boxes for Cost and People.
- Tick the box that says Merge Attributes Onto Existing Type(s)? at the bottom of the menu.
- In the box labelled Please select, choose Projects.
- Finally, click OK to save your changes.
An interactive image is provided below to walk you through these steps.
3. Create the Lens Menu
Now you need to create a place to turn on and off the newly imported lenses.
For Cost
- Go to the Right-Hand Menu, find Lens Groups, and below it click Edit next to Lenses.
- Click the blue + Add button in the new menu shown on screen.
- In the box labelled Name, type Cost.
- On the left, click the little triangle next to Projects to expand it.
- Tick the box for Cost.
- Click OK at the bottom of the menu.
For People
- Stay in the same menu and click the blue + Add button again.
- In the Name box, type People.
- On the left, click the little triangle next to Projects to expand it.
- Tick the box for People.
- Click OK at the bottom.
Below is another interactive image to guide you through these steps.
You may now save your changes by clicking OK on the menu to exit.
4. Turn on the Lenses
All that's left is to see your lenses.
- In the Left-Hand Menu and click the small triangle next to🔎 Lenses to expand it.
- Then, click the small triangle in the new sub menu called Lenses.
- Tick the boxes next to Cost and People.
You should now be able to see all your lenses as shown below.
With that, you've successfully imported and turned on two Conditional Lenses!
Advanced
Below is a manual guide on manipulating conditional lenses, this is intended for Advanced Users who are comfortable editing JSON
Example Illustration
In this illustration you can see an example of some 'Main' boxes, which represent Projects and contain conditionally formatted lenses. Across the top are 'Top' boxes that represent Site locations, these contain Rolled Up Aggregation lenses based on the projects below.
You can download the data and template for this illustration here. Follow this guide to create the illustration above (excluding lenses, which will be shown below.)
Lenses used
Each of the lenses demonstrated above have been curated from our Lens Library. For each Project/'Main' box shown above there is:
- A cost figure in millions on the left, coloured according to which 'bracket' it sits in.
- A count of all people in shades of blue on the right, coloured according to the volume of people.
For the each Site/'Top' box, there is:
-
A count of all projects that belong to the site on the left.
-
A total cost of all projects belonging to each site in the middle.
-
A total of all people across all projects that belong to each site on the right.
Locations from the Lens Library
These exact lenses can be found in Lens Library 3.4, clicking on 23. Conditional Formatting and Rolled Up Aggregation you will see:
- Cost
- People
- Sum of Boxes
- Count of Boxes
| Rolled Up Aggregation (Count and Sum) |
|---|
 |
 |
| Conditional Formatting (Cost and People) | |
|---|---|
 |  |
You will notice that there are only four lenses listed, this is because we used the same 'Sum of Boxes' lens for both the total amount of people per site and total cost per site, this along with how to create these lenses will be explained in the next sections.
Setting up Conditional Formatting
Step 1. Locating the Lenses
To start, we will be importing and setting up the Cost and People badges on the Projects (Main) boxes. Begin by navigating to your local Lens Library located at Clients > Enterprise Lens > Lens Library > Lens Library 3.4.
Opening that, you will see 24 boxes, click on Conditional Formatting & Rolled Up Aggregation to open its Lens Page. Here you can see all available Conditional Formatting lenses.

Navigate to Cost tab on the left side of the Lens Page, and copy the Code section.
Click inside the 'Code' block and press Control + A and Control + C on Windows, or Command + A and Command + C if you are on macOS. This will copy the all code to your clipboard, allowing you to paste it later.

Step 2. Inserting the Lens
Go to your illustration that you are using for this guide, and navigate to the 'Main' (Projects) box type, then to the 'Cost' attribute.
-
Opening the Cost attribute you will see a list of Render Functions. Delete 'Show Text as Attribute' with the 'Delete' button on the right hand side.
-
Click the
+ Addbutton located on the right hand side of the Render Functions title. -
Enter a brief descriptive name, in this example we used
'Show Badge'.infoIn this guide we are using Render Functions for Conditional Formatting and Rolled Up Aggregation badges, but you can also use Render Functions for associations. This is why we have chosen the title
'Show Badge'to distinguish it from an association that could be added later. -
Open the
Typedropdown and select Set Box Properties From ExpressionsThis is important!Forgetting this step means you will not see the lens. This is because the Render Function you are creating needs to know what you are doing, in this case you are instructing it to create badges based on the certain expressions (criteria) you are giving it.
-
Paste the previously copied code for 'Cost' into the
Inputssection. Do not close the menu at this stage.
Step 3. Configuring the Lens
Understanding the Lens
Let's take a look at what you have pasted in a bit more detail.
On the top are the "Box Property Expressions", you can see it there is one set to badge26 followed by a long list of criteria statements. These statements apply a colour on the Cost displayed, according to which statement it meets.
- Display nothing if there is no Cost specified.
- Colour the text red if the Cost is under 0.
- Colour the text black if the Cost is 0.
- Colour the text dark blue if the Cost is between 1 and 999.
- Colour the text blue if the Cost is between 1,000 and 9,999.
- Colour the text green if the Cost is between 10,000 and 99,999.
- Colour the text yellow if the Cost is between 100,000 and 999,999.
- Colour the text orange if the Cost is between 1,000,000 and 9,999,999
- Colour the text purple if the Cost is above 10,000,000
- Otherwise, show nothing (same as 1.)
The referenced colours are defined in the variables at the end of the code block, in addition to the colouring it has al
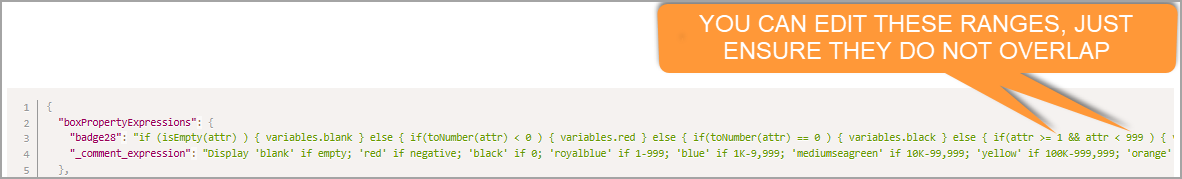
You are able to directly modify these numbers in the expression by replacing them with your own, just ensure your ranges do not overlap (like the above), and do not contain commas. i.e. Enter 1000, not "1,000".
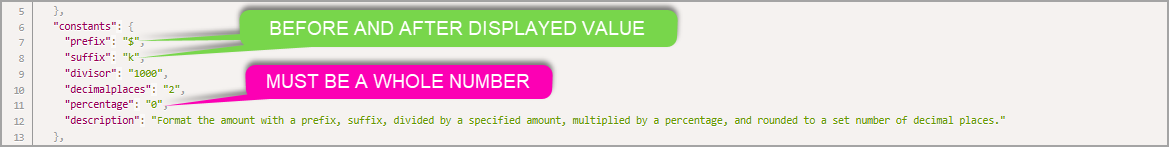
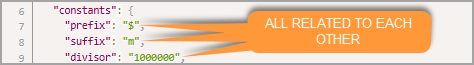
Below that, we have constants. These are all options which affect the number displayed.
| Constant | Definition | Default |
|---|---|---|
prefix | This can be a symbol or word added to the start of your Cost. | $ |
suffix | This can be a symbol or word added to the end of your Cost. | k |
divisor | This is the number to divide your Cost by. | 1000 |
decimalplaces | This is the number of digits after a decimal place to be displayed, if your divisor returns a number with decimals. Otherwise, if a number after the divisor is a full number (i.e. 100) it will not add decimal places. If it is not a full number however (i.e. 12.9371) it will round it (12.94) | 2 |
percentage | This multiplies your cost by a percentage, should you need to add or reduce all costs by a certain percentage. i.e. 10% cost factor added onto costs, enter 10.i.e. 5% discount on all costs, enter -5. | 0 |
The actual attribute value does not change. The value could be 1200 but it might be displayed as $1.2k using the preset values above. It does not change the original value however, only what is shown in the badge.
Changing some options
Given our Costs values are in millions, we need to adjust the suffix and divisor to reflect this. In the code block, edit the following constants:
- Change
divisorto1000000. - Change
suffixtom.
It should now look like this
Step 4. Save your Lens
Now that you've configured your lens, click OK on all your menus to save and exit.
Do not click outside the menus to exit as this will result in unsaved work.
Step 5. Repeat all the steps for the People Lens
- In Step 1 you were looking for
Costlens, instead look forPeoplelens and copy it. - In Step 2, you were modifying the Render Functions for the
Costattribute, do the same processes for thePeopleattribute. - In Step 3, you were introduced to various options in the
constantssection,Peopledoes not have any additional options as it is only a count. - Step 4 is self explanatory, failing to save correctly will undo all your work.
Explaining the Lens
Like the Cost lens, the People lens also has a Box Property Expression. It displays the number of people according to the following conditions.
- Display nothing if number of people is not specified.
- Display the number of people in grey if there are 0 people.
- Display the number of people in light blue if there are less than 50 people.
- Display the number of people in blue if there are 50 to 99 people.
- Display the number of people in dark blue if there are 100 or more people.
- Otherwise, show nothing (same as 1.)

Step 6. Create the Lenses on the Left Hand Menu
In the Right Hand Menu you will see the Lens Groups section.
- Click the
+ Addbutton. - Name the group
Conditional Formatting. - Click the
+ Addlocated on the 'Lenses' row. - Name the Lens
Cost. - Click the dropdown next to
Mainand selectCost. - Click
OK - Repeat steps 3 to 6 with
People. - Click
OKagain to exit the menu.
You will now see the new group and lenses in the left hand menu, as demonstrated by the GIF below.
Setting up Rolled Up Aggregation
Building on Conditionally Formatted lenses, we have Rolled Up Aggregation lenses. These lenses are created in a similar manner, with some adjustments to establish the necessary relationships and attributes.
Step 1. Create an Attribute
Starting off, we will be creating a badge that sums all Project Costs ('Main') that belong to their respective Sites ('Top'). This requires a new attribute in the same box type as the Sites. In this illustration, that would be Filter.Site not Top.
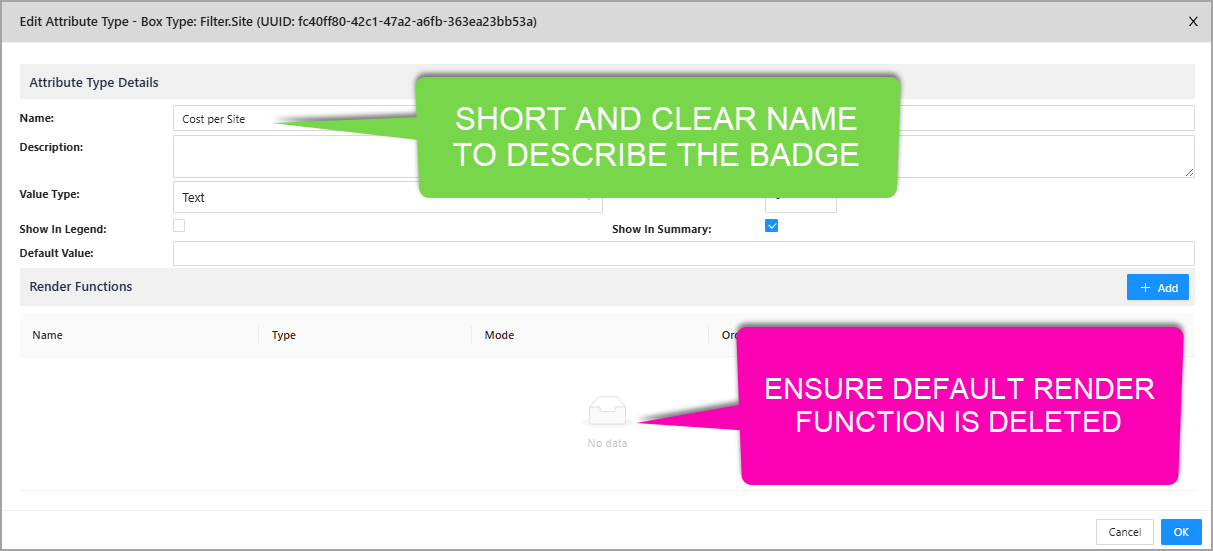
- Open the box type and click
+ Addin the Attribute Types row. - Enter a succinct name for the attribute that reflects what you are representing.
tip
In our example we will be calling it
Costs per Site - Delete the default
Show Attribute as Textrender function as we do not use it. - Click
OKto save all changes.
Step 2. Insert the Lens
Now we need to source the lens. Navigate to your Lens Library and open the Conditional Formatting and Rolled Up Aggregation box. From there, click on the Sum of Boxes lens on the left.
-
Normally where there is a section for 'Code', there are two blocks. This is because the queries that make up aggregation depend on the associations you picked.
-
The illustration you are working on should be using name based associations, and as such you should copy the
Name Association Code.

- Go back to your illustration and open the
Costs per Siteattribute you made earlier. - Create a render function using the same steps demonstrated in Conditional Formatting earlier.
- Name it something appropriate and succinct. i.e.
Show Badge. - Setting the type to
Set Box Properties from Expression. - Paste the copied code into
Inputs.
- Name it something appropriate and succinct. i.e.
Step 3. Configure the Lens
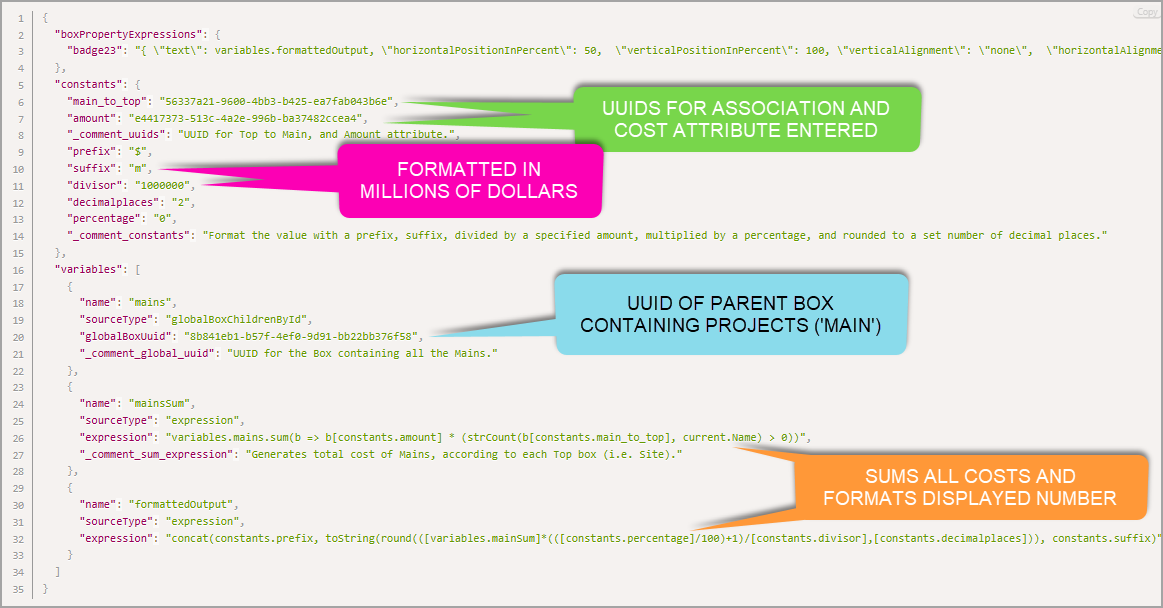
Visually the structure for this lens is quite similar to a conditionally formatted one.
- The badge (
badge23) makes up the Box Property Expression, as there is no set of criteria or conditions to look for. prefix,suffix,divisor,decimalplaces,percentageare all constants with the same behaviour exhibited as we saw in conditional formatting earlier. However, instead of applying to the individual costs, it is applied to the sum of the costs which is calculated by a variable.main_to_topis the UUID of the association attribute's render function. This is the attribute that joins all the Project ('Main') boxes to the Site ('Top') boxes.amountis the UUID of the attribute render function. This is the attribute that will be aggregated or summed from all the project boxes.- In the variables there is a
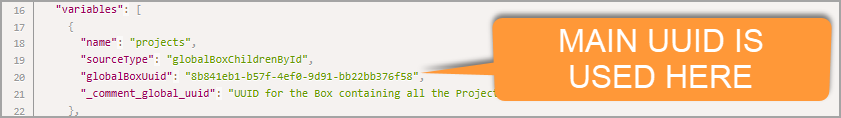
mainvariable with aglobalBoxUuid. This is the UUID of the box that holds all your project boxes. - How to set all UUIDs will be explained below.
main_to_top UUID
Click OK on all the menus to exit back to the illustration. We now need to find the attribute that is responsible for joining the Main boxes TO the Top boxes. Given they are joined via a Name association, and sites are occupying the Top boxes, this means the Site attribute is responsible.
- Open the
Siteattribute from the Main box type. - Click
+ Addin the Render Functions row. - Copy the UUID located on the top of the Edit/Add render function menu.
- Click outside the menu boxes to exit without saving.
note
This is the only time you want to exit without saving, as there is no point in saving an empty render function.
- Navigate back to
Costs Per Site, open the Render Function that you created and paste the UUID inmain_to_top.
Here is a GIF below to illustrate how this is done.
You will also notice a top_to_main field in the code you copied and pasted earlier. You can use the exact same steps above, but instead on the attribute that is FROM the Top box type that joins it TO main. It will usually be named something like JOIN TO Main, JOIN TO Projects etc.
amount UUID
We now need to specify the UUID for the amount that will be added from all projects.
-
As projects use the 'Main' box type, you would use the same steps used to grab the
main_to_topUUID. -
The only difference is that you will be grabbing the UUID of the Cost attribute not Site, as this is the amount we will be adding across projects.
-
Replace the UUID in
amountwith the UUID you grabbed for Cost.
Here is a GIF below to illustrate how this is done.
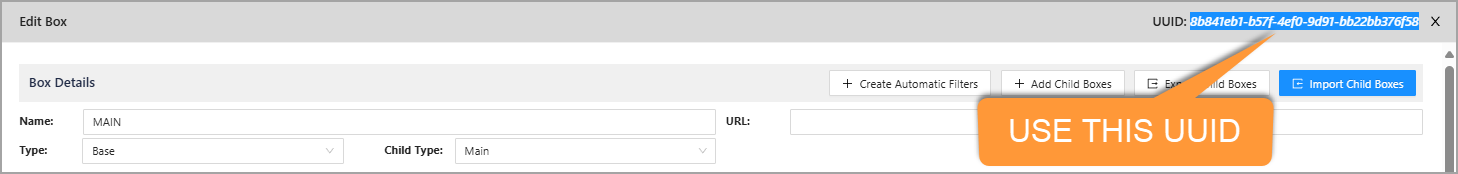
main UUID
This is the easiest out of all UUIDs to obtain, click on the box that holds all the project ('Main') boxes. This is the box that is in the background/behind the project boxes.
- On the top of the editing menu is the UUID.
You cannot fetch the main_to_top or amount UUIDs using this method. Please do not try this, it will not work.
Changing some options
Given our Costs values for the projects are in millions, we need to adjust the suffix and divisor to reflect this. In the code block, edit the following constants:
- Change
divisorto1000000. - Change
suffixtom.
With the correct UUIDs and option adjustments, this is what your Lens will look like.
This is normal, each time you create a new illustration your UUIDs will change. Do not be alarmed!
Step 4. Save your Lens
Now that you've configured your lens, click OK on all your menus to save and exit.
Do not click outside the menus to exit as this will result in unsaved work.
Step 5. Repeat all the steps for Count of Projects and People per Site
The steps are effectively the same for Counts of Projects and People per Site, with minor alterations.
-
For Step 1, you should have two separate attributes named
Count of ProjectsandPeople per Siterespectively. -
For Step 2
- Copy and paste the Count of Boxes Lens for the
Count of Projectsrender function. - Copy and paste the Sum of Boxes Lens for the
People per Siterender function. - It's important you copy the correct lens at this step.
- Copy and paste the Count of Boxes Lens for the
-
For Step 3
-
Count of Projectswill have no extra options. -
Follow the same steps to obtain
main_to_topandmainfor both lenses. -
People per Sitehas several options that need to change.-
Set
prefixandsuffixto""(empty) -
Set divisor to
1. This way the total number of people is accurately reflected.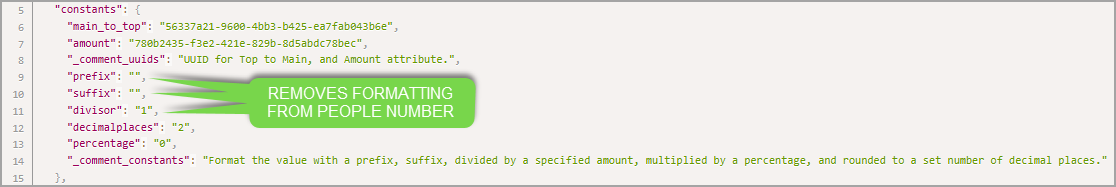
-
Change
badge23tobadge22,horizontalPositionInPercentto100andbackgroundColorto#00aaffin the Box Property Expression like so.

-
-
People per Sitewill need a different UUID foramount.- Follow the same steps to retrieve the UUID for the People attribute in the
Mainbox type and assign it to theamountUUID.
- Follow the same steps to retrieve the UUID for the People attribute in the
-
-
Step 4 is self explanatory, failing to save correctly will undo all your work.
Step 6. Create the Lenses on the Left Hand Menu
In the Right Hand Menu you will see the Lens Groups section, follow the same steps outlined in Conditional Formatting with adjustments like so.
- Click the
+ Addbutton. - Name the group
Rolled Up Aggregation. - Click the
+ Addlocated on the 'Lenses' row. - Name the Lens
Costs per Site. - Click the dropdown next to
Filter.Siteand selectCosts per Site. - Click
OK - Repeat steps 3 to 6 with
People per SiteandProjects per Site. - Click
OKagain to exit the menu.
You will now see the new group and lenses in the left hand menu, as shown below. With that, you've completed this illustration!
Final Notes
- Conditional Formatting and Rolled Up Aggregation is made easy for you as the Illustrator by our Lens Library, which eliminates the need to write anything from scratch.
- Rolled Up Aggregation is similar to Conditional Formatting, it only requires you to establish some UUIDs first.
- The options provided to you in constants allows you to repurpose lenses.
- This is what we asked you to do with
People per SiteandCosts per Siteusing the sameSum of Boxeslens. - This is why the lens names themselves are open ended in the Lens Library.
- This is what we asked you to do with
- There are variables like
mainSumandformattedOutputwhich haven't been discussed, they are created in a language called JavaScript that either count, sum, or format your output according to the options you set in the constants section. We strongly advise you do not edit them.
Congratulations on finishing this guide, with these new skills under your belt you are able to further enrichen your story telling to further heights!